
Social media influence and information gerrymandering
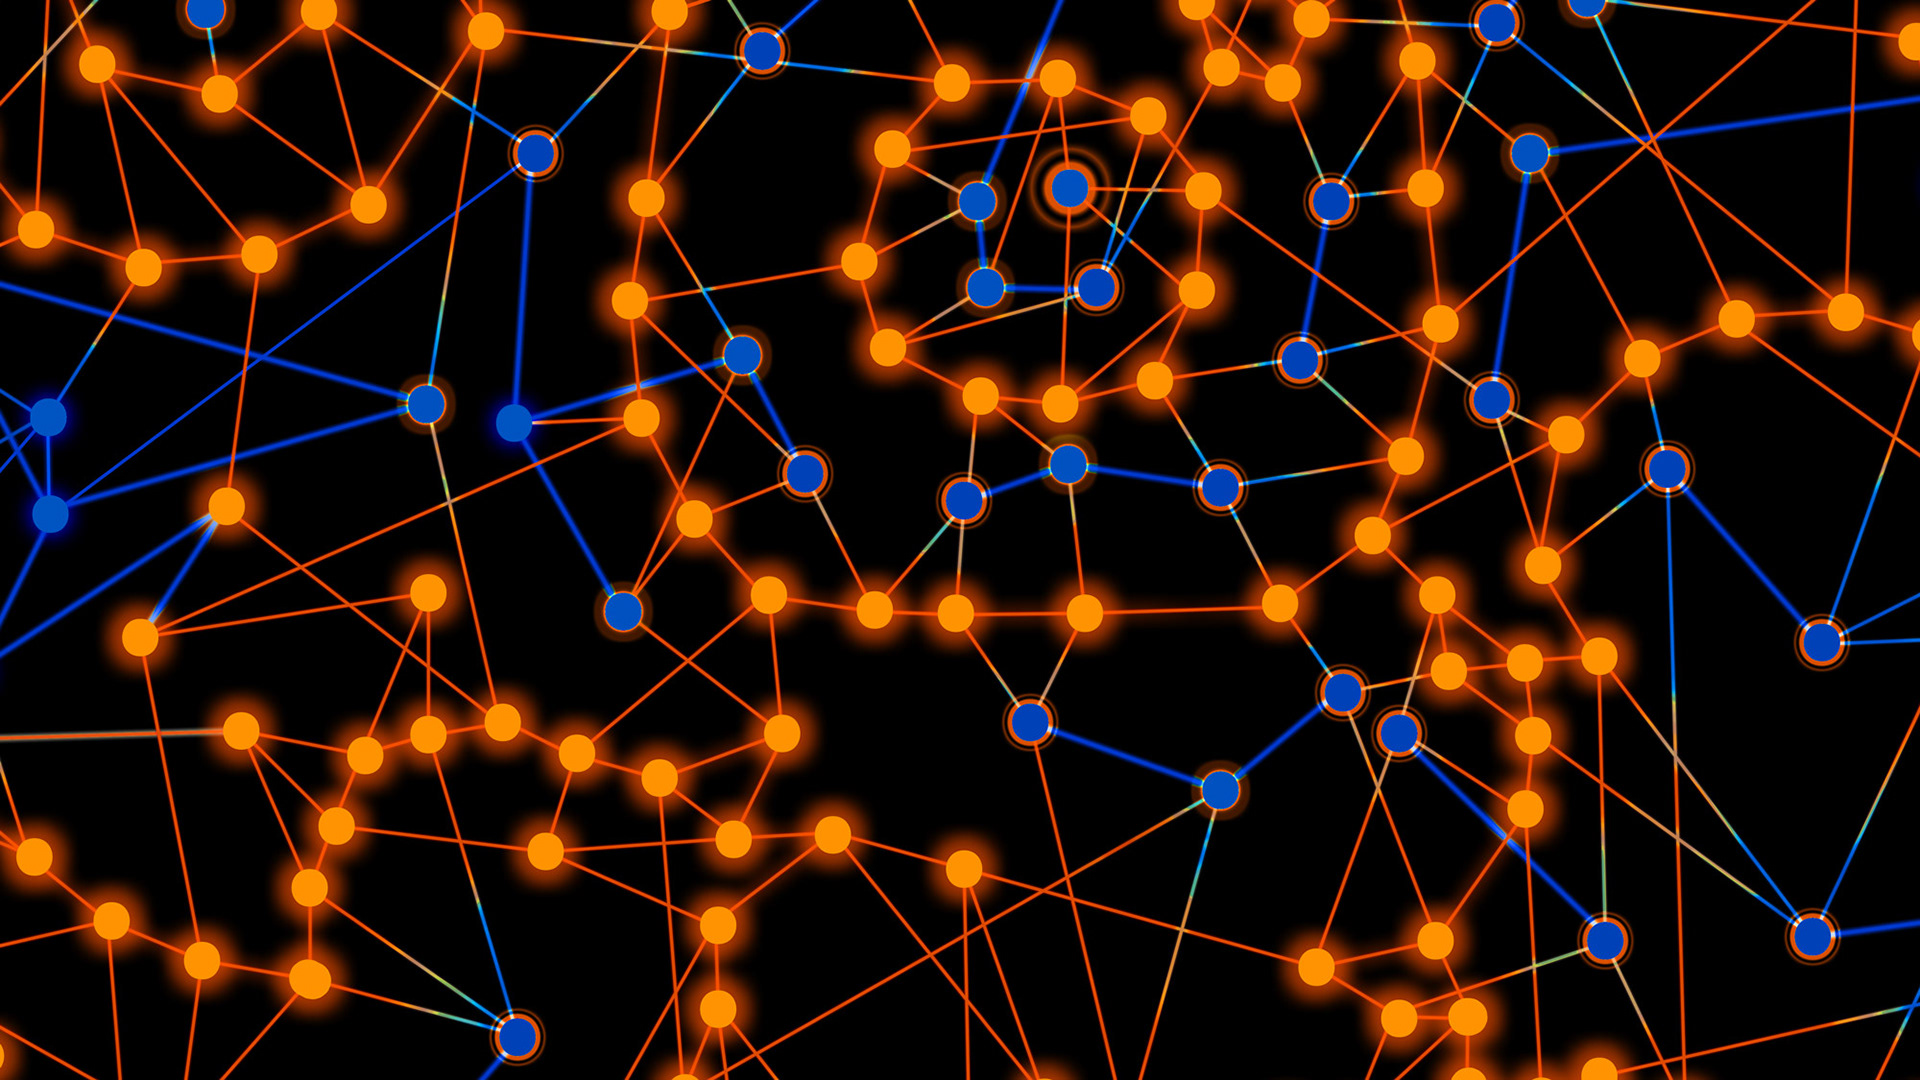
Artwork designed for Stile Education Art of Science project, a project aimed to challenge students through thought provoking images. The artwork is used for Stile's login screen, an accompanying Science lesson and A1 Posters and postcards.
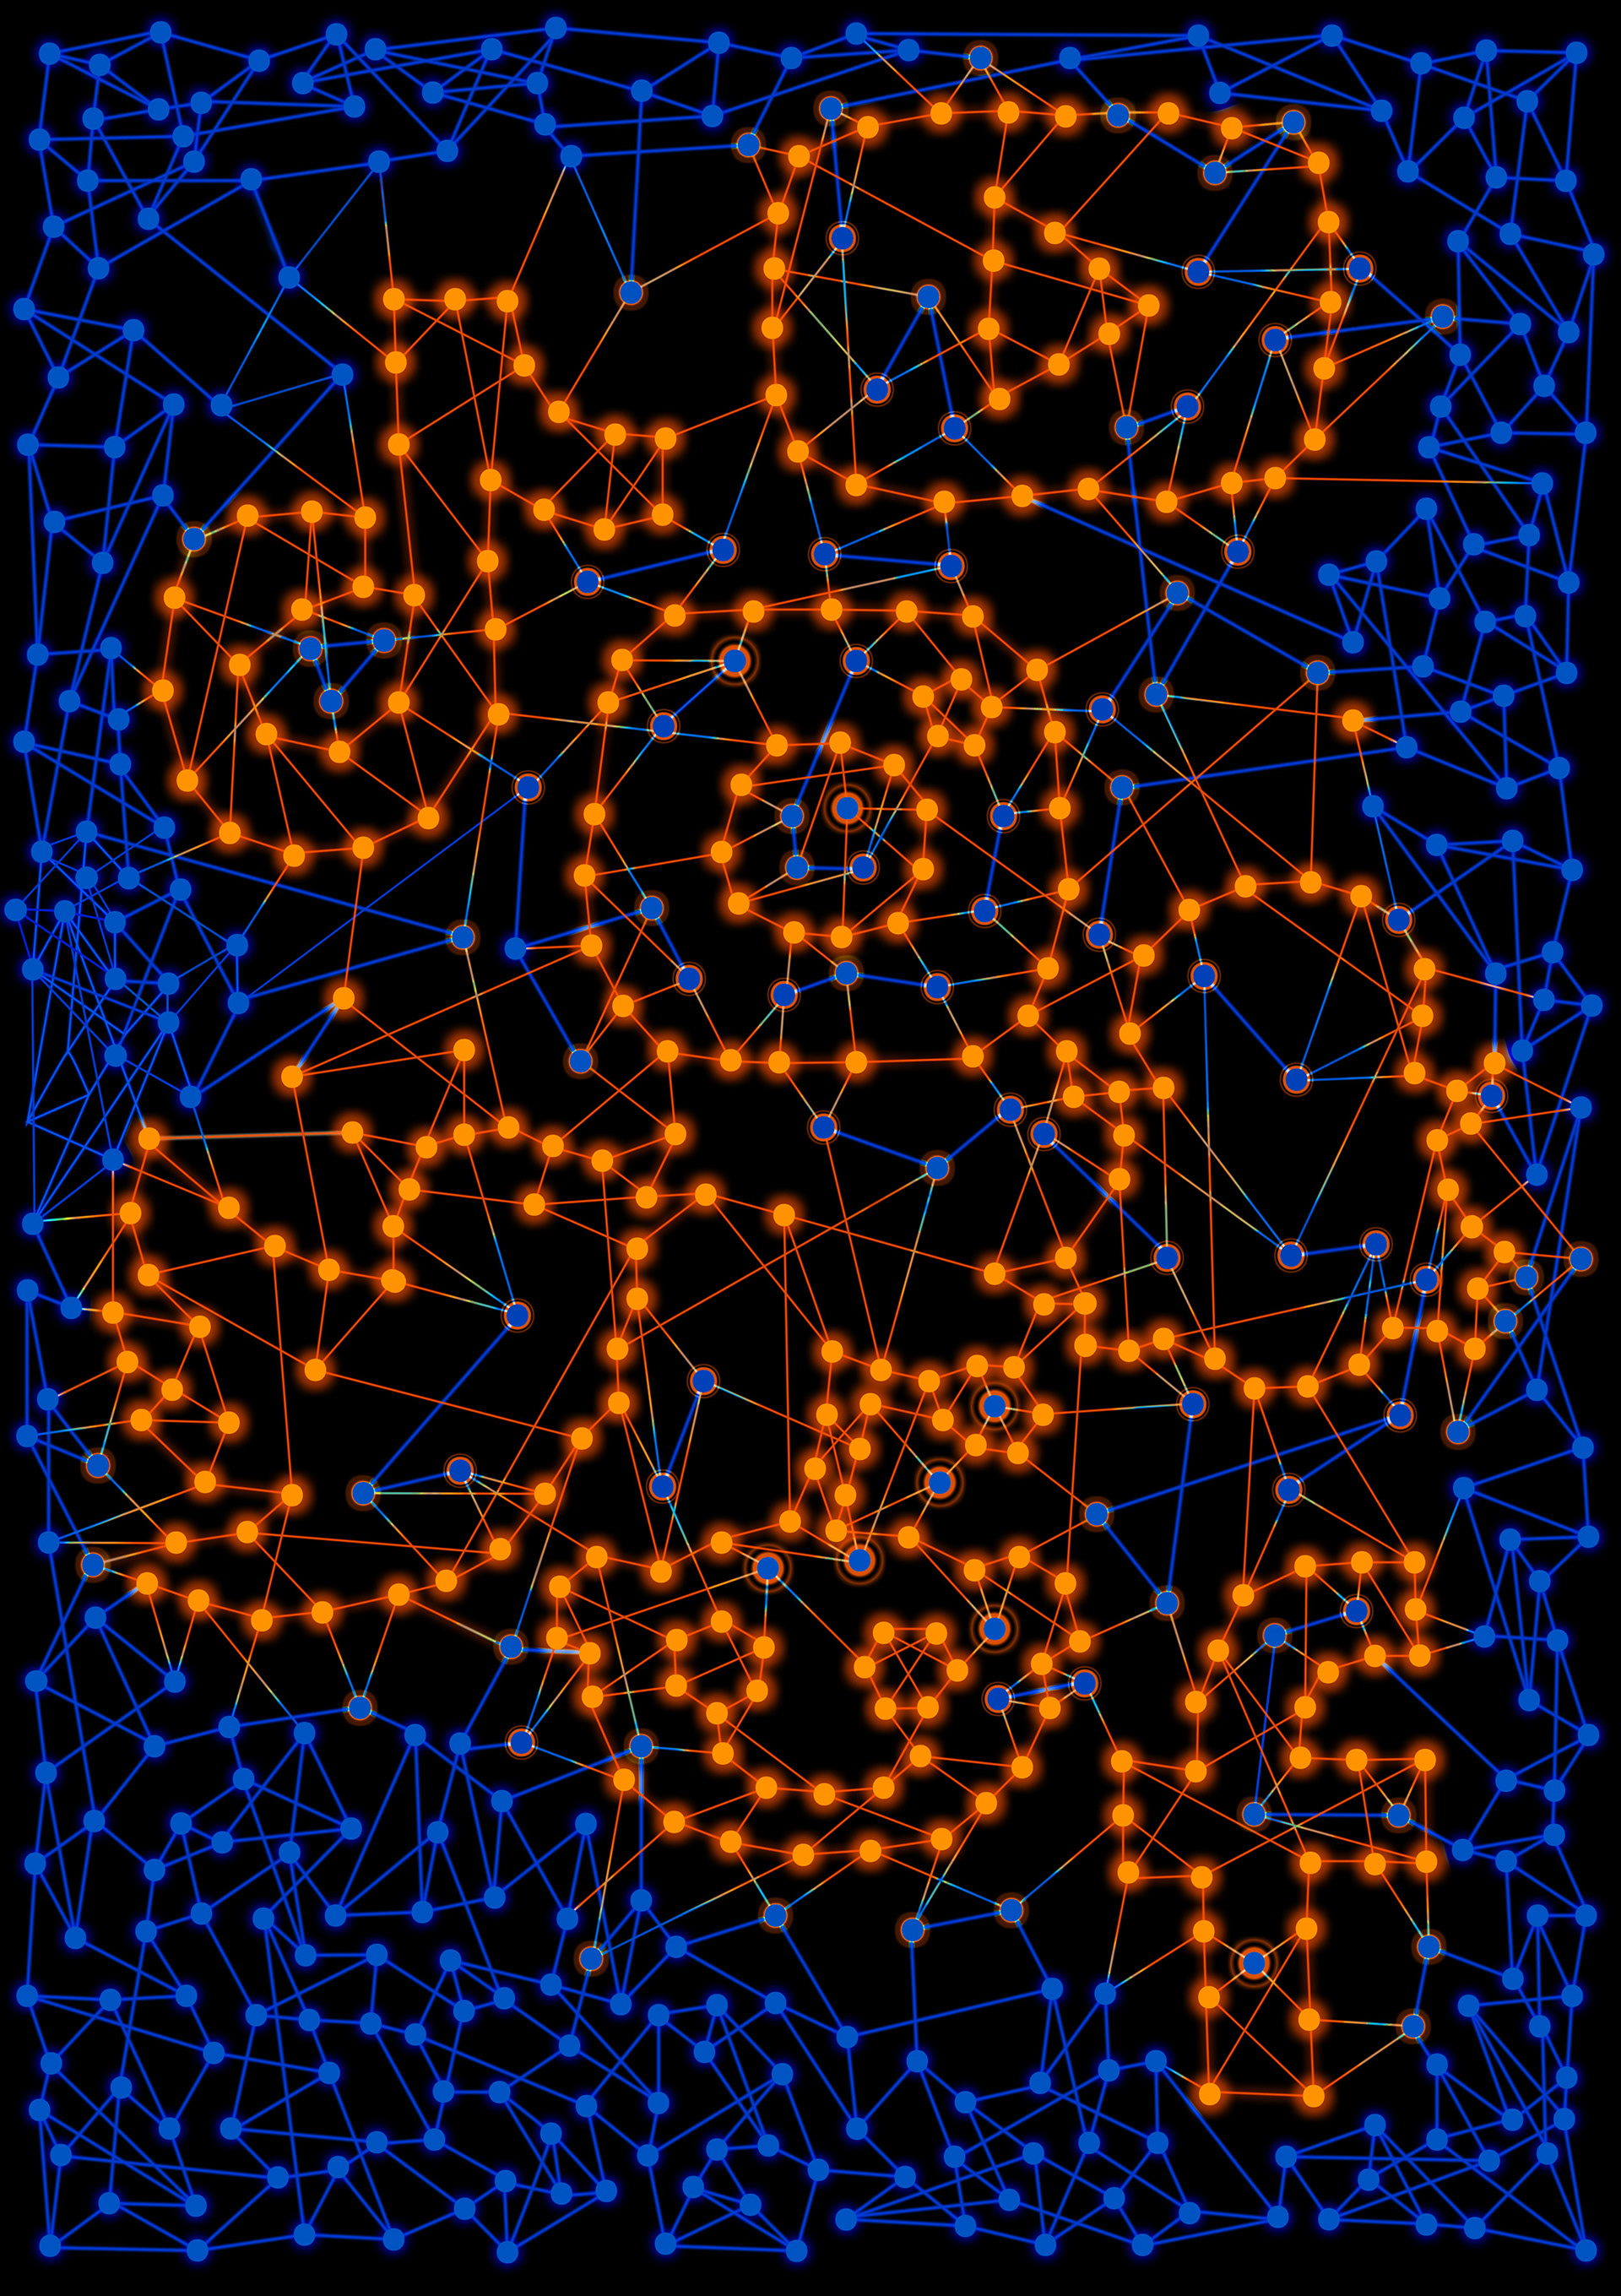
This project was very challenging as I wanted to not only show the concept of filter bubbles, but digital gerrymandering (arranging information so that people are shown a majority of opposing views and change their mind). A lot of trial and error with counting dots, connections and getting maths to work!
Even though there is a blue majority, a small amount of digital gerrymandering can be enough to change an outcome
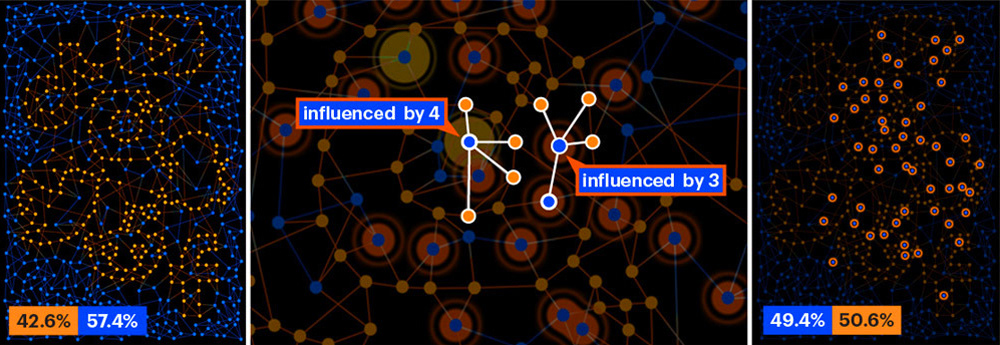
Here's a breakdown of the maths behind the artwork:
○ There are 638 total dots.
○ Each represents a person and has 4 connections on social media.
○ 366 Blue (majority by 57.4%).
○ 269 of the Blues will perceive majority of Blue connections (4-0 or 3-1). By being
grouped together they are part of the gerrymandering.
○ 46 perceive a tie of 2-2. They are likely to stick to Blue preference.
○ 51 Blues are arranged to see majority of Orange 0-4 and 1-3.
○ By influenting these small percentage, the outcome of an election could be swayed.
○ From having a margin of 94 votes, Blues end up losing by 8 votes
○ Orange would now be the majority by a 1.2% margin. Scary...
Now, think about how does social media influence, watch the Social dilemma! and Learn more in this comprehensive post by Clare Feeney, Head of Product at Stile Education.